Phase 2 Project Contributions#
In Phase 2 of our project, I contributed by accessing and cleaning data from five different APIs from Eurostat, creating dataframes to contain our healthcare, education, safety, environment, and public infrastructure data. I also cleaned quality of life data from a CSV file from the World Happiness Report into a dataframe as well. I then combined all these dataframes into a single dataframe that contained all data for health, education, safety, environment, infrastructure, and quality of life, standardized all values, and then plotted all of the factors against quality of life in Plotly to try to see if there was any immediately visible relationship between quality of life and any of our five factors. In addition, I wrote the data visualization section of our team blog post, as I was the one who created all of our visualizations, and also contributed to the sections regarding changes from phase 1 and our preliminary ML model.
Experiences on the Dialogue#
This week has been really fun! I think I’m really getting into the groove of things and solidifying relationships with a lot of really cool people. I’ve also been eating a lot of good food and seeing lots of cool things, pictured below:
Waffles!#
This was so delicious.
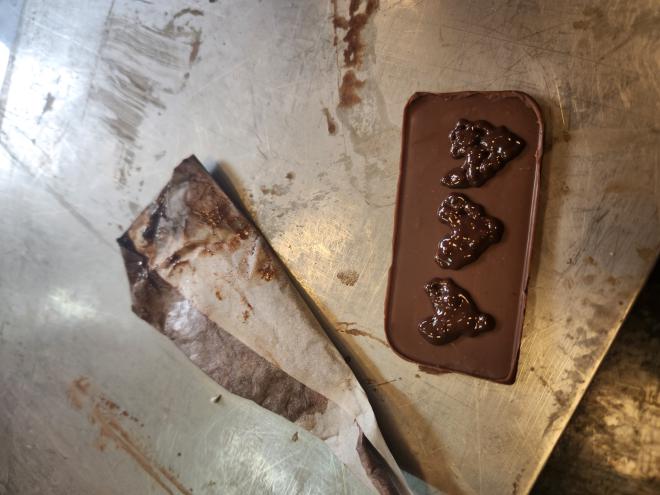
Chocolate Writing!#
I was really bad at this.
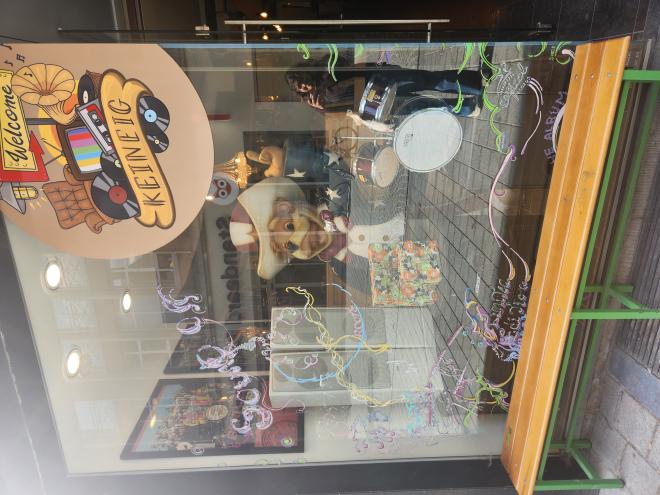
This guy?#
Reminded me of home!