Phase 4 Project Contributions#
In Phase 4 of our project, I contributed by finishing up our time-series autoregressive model, creating a data pipeline that, given data for quality of life, year, and country, took in a country and returned a list of dicts of historical and predicted quality of life scores 2011-2027, which could then be inputted to a function I made to graph historical and predicted quality of life scores for one or two countries. This graph is displayed on pages for all three of our user personas. I also cross-validated this model and made residual plots to assess assumptions for the model as well. I also assisted in implementing this model onto our website, and made some small UI contributions that made our website more user-friendly. I also wrote large parts of our team blog post in relation to the time-series model.
Experiences on the Dialogue#
The last week here has been an absolute whirlwind of emotions and high stress. Ultimately, I am deeply grateful for all the experiences I’ve had here, and all the experience I’ve gained, technically and practically. Highlights below:
Coal Mine#
I thought I was going to die after climbing all the stairs to get up here.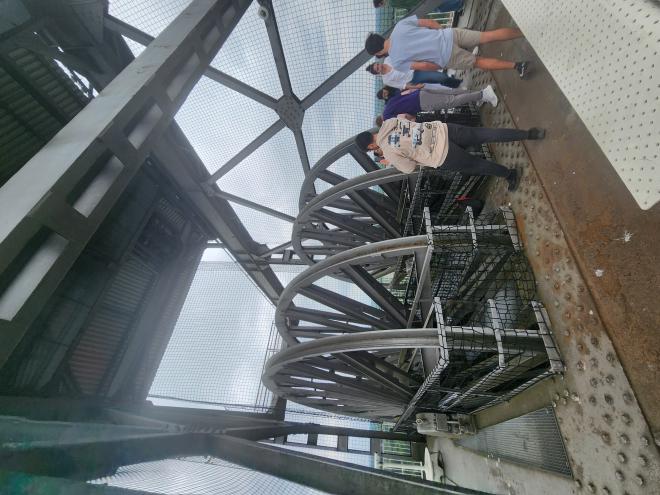
Awesome View#
View made it worth it, though.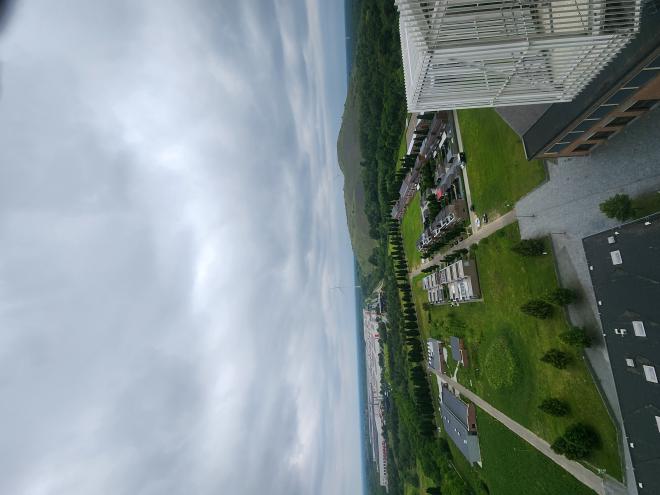
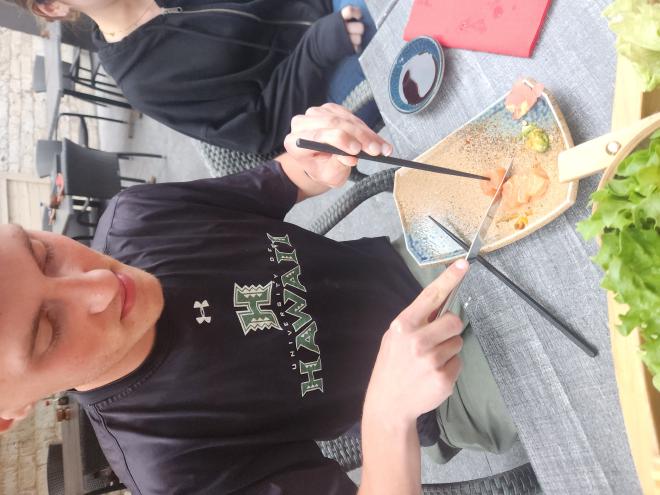
Adventures in Chopstick Usage#
I’m not good at using chopsticks, but I’m not this bad.